Note
Click here to download the full example code
6 - GSTools
With version 0.5 scikit-gstat offers an interface to the awesome gstools
library. This way, you can use a Variogram estimated with scikit-gstat
in gstools to perform random field generation, kriging and much, much more.
For a Variogram instance, there are three possibilities to export into gstools :
Variogram.get_empirical(bin_center=True)returns a pair of distance lag bins and experimental semi-variance values, like gstools.variogram.vario_estimate.
Variogram.to_gstoolsreturns a parameterizedCovModelderived from the Variogram.
Variogram.to_gs_krigereturns aGSTools Krigeinstance based on the variogram
6.1 get_empirical
6.1.1 Reproducing the gstools example
You can reproduce the Getting Started example for variogram estimation from GSTools docs
with scikit-gstat, and replace the calculation of the empirical variogram with skg.Variogram.
Note: This does only make sense if you want to use a distance metric, binning procedure or semi-variance estimator, that is not included in gstools or are bound to scikit-gstat for any other reason. Variogram will _always_ perform a full model fitting cycle on instantiation, which could lead to some substantial overhead here.
This behavior might change in a future version of scikit-gstat.
# import
import skgstat as skg
import gstools as gs
import numpy as np
import matplotlib.pyplot as plt
import warnings
warnings.filterwarnings('ignore')
skg.plotting.backend('matplotlib')
use the example from gstools generate a synthetic field with an exponential model
x = np.random.RandomState(19970221).rand(1000) * 100.
y = np.random.RandomState(20011012).rand(1000) * 100.
model = gs.Exponential(dim=2, var=2, len_scale=8)
srf = gs.SRF(model, mean=0, seed=19970221)
field = srf((x, y))
combine x and y for use in skgstat
coords = np.column_stack((x, y))
In the example, gstools.variogram.vario_estimate is used to estimate the empirical variogram:
# estimate the variogram of the field
bin_center, gamma = gs.vario_estimate((x, y), field)
Here, we can use skg.Variogram.
From the shown arguments, estimator and
bin_func are using the default values:
V = skg.Variogram(coords, field, n_lags=21, estimator='matheron', maxlag=45, bin_func='even')
bin_center, gamma = V.get_empirical(bin_center=True)
And finally, the exact same code from the GSTools docs can be called: fit the variogram with a stable model. (no nugget fitted)
fit_model = gs.Stable(dim=2)
fit_model.fit_variogram(bin_center, gamma, nugget=False)
Out:
({'var': 1.8664974461650707, 'len_scale': 7.55213214397261, 'nugget': 0.0, 'alpha': 1.0793627970861974}, array([[ 0.00108441,  0.00941099, -0.00177539],
       [ 0.00941099,  0.21779646, -0.00626952],
       [-0.00177539, -0.00626952,  0.01007306]]))
Output the model
ax = fit_model.plot(x_max=max(bin_center))
ax.scatter(bin_center, gamma)
print(fit_model)

Out:
Stable(dim=2, var=1.87, len_scale=7.55, nugget=0.0, alpha=1.08)
6.1.2 bin_center=False
It is important to understand, that gstools and skgstat are handling lag bins different.
While skgstat uses the upper limit, gstools assumes the bin center.
This can have implications, if a model is fitted. C
onsider the example below, in which only the bin_center setting is different.
bin_edges, _ = V.get_empirical(bin_center=False)

# fit the variogram with a stable model. (no nugget fitted)
edge_model = gs.Stable(dim=2)
_ = edge_model.fit_variogram(bin_edges, gamma, nugget=False)
Make a nice plot
fig, axes = plt.subplots(1, 2, figsize=(12, 4))

# plot first
fit_model.plot(ax=axes[1], label='center=True')
# plot second
edge_model.plot(ax=axes[1], label='center=False')

# bins
axes[0].scatter(bin_center, gamma, label='center=True')
axes[0].scatter(bin_edges, gamma, label='center=False')

axes[0].set_title('Empirical Variogram')
axes[1].set_title('Variogram Model')
axes[0].legend(loc='lower right')
print(fit_model)
print(edge_model)

Out:
Stable(dim=2, var=1.87, len_scale=7.55, nugget=0.0, alpha=1.08)
Stable(dim=2, var=1.86, len_scale=8.8, nugget=0.0, alpha=1.27)
Notice the considerable gap between the two model functions. This can already lead to seroius differences, i.e. in Kriging.
6.1.3 Using other arguments
Now, with the example from the GSTools docs working, we can start chaning the arguments to create quite different empirical variograms.
Note: This should just illustrate the available possibilities, the result is by no means producing a better estimate of the initially created Gaussian random field.
In this example different things will be changed:
use only 15 lag classes, but distribute the point pairs equally. Note the differing widths of the classes. (
bin_func='uniform')The
Dowdestimator is used. (estimator='dowd')The Taxicab metric (https://en.wikipedia.org/wiki/Taxicab_geometry) (aka. Manhattan metric or cityblock metric) is used over
Euklidean for no obvious reason. (dist_func='cityblock')
V = skg.Variogram(coords, field, n_lags=15, estimator='dowd', maxlag=45, bin_func='uniform', dist_func='cityblock')
bin_center, gamma = V.get_empirical(bin_center=True)
fit the variogram with a stable model. (no nugget fitted)
fit_model = gs.Stable(dim=2)
fit_model.fit_variogram(bin_center, gamma, nugget=True)

# output
ax = fit_model.plot(x_max=max(bin_center))
ax.scatter(bin_center, gamma)
print(fit_model)

Out:
Stable(dim=2, var=2.66, len_scale=17.3, nugget=1.42, alpha=2.0)
If you fit the gs.Stable with a nugget, it fits quite well. But keep in mind that this does not necessarily describe the original field very well and was just fitted for demonstration.
6.2 to_gstools
The second possible interface to gstools is the Variogram.to_gstools function.
This will return one of the classes listed in the gstools documentation.
The variogram parameters are extracted and passed to gstools. You should be able to use it, just like any other CovModel.
However, there are a few things to consider:
skgstatcan only export isotropic models.The
'harmonize'cannot be exported
6.2.1 exporting Variogram
In this example, the same Variogram from above is estimated, but we use the exponential model.
An exponential covariance function was used in the first place to create the field that was sampled.
Out:
{'text/html': '<div> <script src="https://cdnjs.cloudflare.com/ajax/libs/mathjax/2.7.5/MathJax.js?config=TeX-AMS-MML_SVG"></script><script type="text/javascript">if (window.MathJax) {MathJax.Hub.Config({SVG: {font: "STIX-Web"}});}</script> <script type="text/javascript">window.PlotlyConfig = {MathJaxConfig: \'local\'};</script>\n <script src="https://cdn.plot.ly/plotly-2.8.3.min.js"></script> <div id="fd8fa581-9643-495e-ac7d-d33753fd561e" class="plotly-graph-div" style="height:525px; width:100%;"></div> <script type="text/javascript"> window.PLOTLYENV=window.PLOTLYENV || {}; if (document.getElementById("fd8fa581-9643-495e-ac7d-d33753fd561e")) { Plotly.newPlot( "fd8fa581-9643-495e-ac7d-d33753fd561e", [{"marker":{"color":"blue"},"mode":"markers","name":"Experimental","x":[2.142855635407179,4.285711270814358,6.428566906221537,8.571422541628715,10.714278177035894,12.857133812443074,14.999989447850252,17.14284508325743,19.28570071866461,21.428556354071787,23.571411989478968,25.714267624886148,27.857123260293324,29.999978895700504,32.14283453110768,34.28569016651486,36.42854580192204,38.57140143732922,40.714257072736395,42.857112708143575,44.999968343550755],"y":[0.30897705415986504,0.6208643402313241,0.921715477382577,1.1548899565562452,1.3748193307059289,1.436033393190171,1.5467070540577679,1.5750569573916573,1.7346787923995224,1.821569238738882,1.8907721626858394,1.919231555029339,1.9968492518293,1.9240685287854309,1.9009947561824516,1.8395779821361937,1.8162192028142332,1.847237052925572,1.7901619343635395,1.782111939557358,1.6977260802722909],"type":"scatter","xaxis":"x2","yaxis":"y2"},{"marker":{"color":"green"},"mode":"lines","name":"exponential model","x":[0.0,0.45454513478334096,0.9090902695666819,1.363635404350023,1.8181805391333639,2.272725673916705,2.727270808700046,3.181815943483387,3.6363610782667277,4.090906213050069,4.54545134783341,4.9999964826167504,5.454541617400092,5.909086752183432,6.363631886966774,6.818177021750114,7.272722156533455,7.727267291316797,8.181812426100137,8.636357560883479,9.09090269566682,9.54544783045016,9.999992965233501,10.454538100016842,10.909083234800184,11.363628369583525,11.818173504366865,12.272718639150206,12.727263773933547,13.181808908716889,13.636354043500228,14.09089917828357,14.54544431306691,14.999989447850252,15.454534582633594,15.909079717416933,16.363624852200275,16.818169986983616,17.272715121766957,17.7272602565503,18.18180539133364,18.63635052611698,19.09089566090032,19.54544079568366,19.999985930467002,20.454531065250343,20.909076200033685,21.363621334817026,21.818166469600367,22.27271160438371,22.72725673916705,23.181801873950388,23.63634700873373,24.09089214351707,24.545437278300412,24.999982413083753,25.454527547867094,25.909072682650436,26.363617817433777,26.81816295221712,27.272708087000456,27.727253221783798,28.18179835656714,28.63634349135048,29.09088862613382,29.545433760917163,29.999978895700504,30.454524030483846,30.909069165267187,31.363614300050525,31.818159434833866,32.27270456961721,32.72724970440055,33.181794839183894,33.63633997396723,34.09088510875057,34.545430243533914,34.99997537831725,35.4545205131006,35.909065647883935,36.36361078266728,36.81815591745062,37.27270105223396,37.7272461870173,38.18179132180064,38.63633645658398,39.09088159136732,39.545426726150666,39.999971860934004,40.45451699571735,40.909062130500686,41.36360726528403,41.81815240006737,42.27269753485071,42.72724266963405,43.18178780441739,43.636332939200734,44.09087807398407,44.54542320876742,44.999968343550755],"y":[0.0,0.09498362315108147,0.18522860084168363,0.2709713397286089,0.3524364523583285,0.4298373455642824,0.5033767795095802,0.5732473988395751,0.6396322373357274,0.7027051973927506,0.7626315055750837,0.8195681454460721,0.8736642688036987,0.9250615864001422,0.9738947391686997,1.0202916509305362,1.0643738635052213,1.1062568551029108,1.1460503428322333,1.1838585701163393,1.2197805797700272,1.2539104734533015,1.286337658181037,1.317147080534497,1.3464194491882575,1.3742314463354695,1.4006559285653053,1.4257621177188207,1.449615782223187,1.472279409379329,1.4938123690542926,1.5142710692071473,1.533709103655848,1.5521773924721411,1.5697243153723022,1.5863958384531283,1.6022356346051911,1.6172851979187837,1.631583952382258,1.645169355157504,1.658076994703111,1.6703406840022526,1.681992549139521,1.6930631134587417,1.703581377522236,1.7135748950809842,1.7230698452547144,1.732091101110987,1.740662294822934,1.748805879576341,1.7565431883882379,1.7638944899910867,1.7708790419289584,1.7775151410047907,1.7838201712108772,1.7898106492681505,1.7955022678935504,1.800909936908825,1.8060478222984504,1.8109293833189863,1.815567407757082,1.8199740454284905,1.8241608400058493,1.8281387592586016,1.8319182237842773,1.8355091343063945,1.8389208976104952,1.8421624511862569,1.8452422866402298,1.848168471940536,1.8509486725518,1.8535901715156775,1.8560998885295854,1.8584843980736105,1.8607499466330846,1.8629024690619407,1.8649476041297162,1.8668907092929306,1.8687368747295325,1.8704909366731826,1.8721574900822988,1.8737409006770562,1.8752453163758729,1.876674678161337,1.8780327304040467,1.8793230306714,1.8805489590470341,1.8817137269853281,1.88282038572416,1.8838718342779615,1.8848708270320038,1.885819980957815,1.8867217824686242,1.887578593932795,1.8883926598623098,1.889166112792515,1.8899009788685341,1.8905991831529763,1.8912625546688504,1.891892831190893],"type":"scatter","xaxis":"x2","yaxis":"y2"},{"marker":{"color":"red"},"name":"Histogram","x":[2.142855635407179,4.285711270814358,6.428566906221537,8.571422541628715,10.714278177035894,12.857133812443074,14.999989447850252,17.14284508325743,19.28570071866461,21.428556354071787,23.571411989478968,25.714267624886148,27.857123260293324,29.999978895700504,32.14283453110768,34.28569016651486,36.42854580192204,38.57140143732922,40.714257072736395,42.857112708143575,44.999968343550755],"y":[690,2057,3379,4554,5586,6641,7499,8636,9319,10176,10569,11296,12048,12384,12985,13276,13575,13926,14070,14492,14666],"type":"bar"}], {"template":{"data":{"bar":[{"error_x":{"color":"#2a3f5f"},"error_y":{"color":"#2a3f5f"},"marker":{"line":{"color":"#E5ECF6","width":0.5},"pattern":{"fillmode":"overlay","size":10,"solidity":0.2}},"type":"bar"}],"barpolar":[{"marker":{"line":{"color":"#E5ECF6","width":0.5},"pattern":{"fillmode":"overlay","size":10,"solidity":0.2}},"type":"barpolar"}],"carpet":[{"aaxis":{"endlinecolor":"#2a3f5f","gridcolor":"white","linecolor":"white","minorgridcolor":"white","startlinecolor":"#2a3f5f"},"baxis":{"endlinecolor":"#2a3f5f","gridcolor":"white","linecolor":"white","minorgridcolor":"white","startlinecolor":"#2a3f5f"},"type":"carpet"}],"choropleth":[{"colorbar":{"outlinewidth":0,"ticks":""},"type":"choropleth"}],"contour":[{"colorbar":{"outlinewidth":0,"ticks":""},"colorscale":[[0.0,"#0d0887"],[0.1111111111111111,"#46039f"],[0.2222222222222222,"#7201a8"],[0.3333333333333333,"#9c179e"],[0.4444444444444444,"#bd3786"],[0.5555555555555556,"#d8576b"],[0.6666666666666666,"#ed7953"],[0.7777777777777778,"#fb9f3a"],[0.8888888888888888,"#fdca26"],[1.0,"#f0f921"]],"type":"contour"}],"contourcarpet":[{"colorbar":{"outlinewidth":0,"ticks":""},"type":"contourcarpet"}],"heatmap":[{"colorbar":{"outlinewidth":0,"ticks":""},"colorscale":[[0.0,"#0d0887"],[0.1111111111111111,"#46039f"],[0.2222222222222222,"#7201a8"],[0.3333333333333333,"#9c179e"],[0.4444444444444444,"#bd3786"],[0.5555555555555556,"#d8576b"],[0.6666666666666666,"#ed7953"],[0.7777777777777778,"#fb9f3a"],[0.8888888888888888,"#fdca26"],[1.0,"#f0f921"]],"type":"heatmap"}],"heatmapgl":[{"colorbar":{"outlinewidth":0,"ticks":""},"colorscale":[[0.0,"#0d0887"],[0.1111111111111111,"#46039f"],[0.2222222222222222,"#7201a8"],[0.3333333333333333,"#9c179e"],[0.4444444444444444,"#bd3786"],[0.5555555555555556,"#d8576b"],[0.6666666666666666,"#ed7953"],[0.7777777777777778,"#fb9f3a"],[0.8888888888888888,"#fdca26"],[1.0,"#f0f921"]],"type":"heatmapgl"}],"histogram":[{"marker":{"pattern":{"fillmode":"overlay","size":10,"solidity":0.2}},"type":"histogram"}],"histogram2d":[{"colorbar":{"outlinewidth":0,"ticks":""},"colorscale":[[0.0,"#0d0887"],[0.1111111111111111,"#46039f"],[0.2222222222222222,"#7201a8"],[0.3333333333333333,"#9c179e"],[0.4444444444444444,"#bd3786"],[0.5555555555555556,"#d8576b"],[0.6666666666666666,"#ed7953"],[0.7777777777777778,"#fb9f3a"],[0.8888888888888888,"#fdca26"],[1.0,"#f0f921"]],"type":"histogram2d"}],"histogram2dcontour":[{"colorbar":{"outlinewidth":0,"ticks":""},"colorscale":[[0.0,"#0d0887"],[0.1111111111111111,"#46039f"],[0.2222222222222222,"#7201a8"],[0.3333333333333333,"#9c179e"],[0.4444444444444444,"#bd3786"],[0.5555555555555556,"#d8576b"],[0.6666666666666666,"#ed7953"],[0.7777777777777778,"#fb9f3a"],[0.8888888888888888,"#fdca26"],[1.0,"#f0f921"]],"type":"histogram2dcontour"}],"mesh3d":[{"colorbar":{"outlinewidth":0,"ticks":""},"type":"mesh3d"}],"parcoords":[{"line":{"colorbar":{"outlinewidth":0,"ticks":""}},"type":"parcoords"}],"pie":[{"automargin":true,"type":"pie"}],"scatter":[{"marker":{"colorbar":{"outlinewidth":0,"ticks":""}},"type":"scatter"}],"scatter3d":[{"line":{"colorbar":{"outlinewidth":0,"ticks":""}},"marker":{"colorbar":{"outlinewidth":0,"ticks":""}},"type":"scatter3d"}],"scattercarpet":[{"marker":{"colorbar":{"outlinewidth":0,"ticks":""}},"type":"scattercarpet"}],"scattergeo":[{"marker":{"colorbar":{"outlinewidth":0,"ticks":""}},"type":"scattergeo"}],"scattergl":[{"marker":{"colorbar":{"outlinewidth":0,"ticks":""}},"type":"scattergl"}],"scattermapbox":[{"marker":{"colorbar":{"outlinewidth":0,"ticks":""}},"type":"scattermapbox"}],"scatterpolar":[{"marker":{"colorbar":{"outlinewidth":0,"ticks":""}},"type":"scatterpolar"}],"scatterpolargl":[{"marker":{"colorbar":{"outlinewidth":0,"ticks":""}},"type":"scatterpolargl"}],"scatterternary":[{"marker":{"colorbar":{"outlinewidth":0,"ticks":""}},"type":"scatterternary"}],"surface":[{"colorbar":{"outlinewidth":0,"ticks":""},"colorscale":[[0.0,"#0d0887"],[0.1111111111111111,"#46039f"],[0.2222222222222222,"#7201a8"],[0.3333333333333333,"#9c179e"],[0.4444444444444444,"#bd3786"],[0.5555555555555556,"#d8576b"],[0.6666666666666666,"#ed7953"],[0.7777777777777778,"#fb9f3a"],[0.8888888888888888,"#fdca26"],[1.0,"#f0f921"]],"type":"surface"}],"table":[{"cells":{"fill":{"color":"#EBF0F8"},"line":{"color":"white"}},"header":{"fill":{"color":"#C8D4E3"},"line":{"color":"white"}},"type":"table"}]},"layout":{"annotationdefaults":{"arrowcolor":"#2a3f5f","arrowhead":0,"arrowwidth":1},"autotypenumbers":"strict","coloraxis":{"colorbar":{"outlinewidth":0,"ticks":""}},"colorscale":{"diverging":[[0,"#8e0152"],[0.1,"#c51b7d"],[0.2,"#de77ae"],[0.3,"#f1b6da"],[0.4,"#fde0ef"],[0.5,"#f7f7f7"],[0.6,"#e6f5d0"],[0.7,"#b8e186"],[0.8,"#7fbc41"],[0.9,"#4d9221"],[1,"#276419"]],"sequential":[[0.0,"#0d0887"],[0.1111111111111111,"#46039f"],[0.2222222222222222,"#7201a8"],[0.3333333333333333,"#9c179e"],[0.4444444444444444,"#bd3786"],[0.5555555555555556,"#d8576b"],[0.6666666666666666,"#ed7953"],[0.7777777777777778,"#fb9f3a"],[0.8888888888888888,"#fdca26"],[1.0,"#f0f921"]],"sequentialminus":[[0.0,"#0d0887"],[0.1111111111111111,"#46039f"],[0.2222222222222222,"#7201a8"],[0.3333333333333333,"#9c179e"],[0.4444444444444444,"#bd3786"],[0.5555555555555556,"#d8576b"],[0.6666666666666666,"#ed7953"],[0.7777777777777778,"#fb9f3a"],[0.8888888888888888,"#fdca26"],[1.0,"#f0f921"]]},"colorway":["#636efa","#EF553B","#00cc96","#ab63fa","#FFA15A","#19d3f3","#FF6692","#B6E880","#FF97FF","#FECB52"],"font":{"color":"#2a3f5f"},"geo":{"bgcolor":"white","lakecolor":"white","landcolor":"#E5ECF6","showlakes":true,"showland":true,"subunitcolor":"white"},"hoverlabel":{"align":"left"},"hovermode":"closest","mapbox":{"style":"light"},"paper_bgcolor":"white","plot_bgcolor":"#E5ECF6","polar":{"angularaxis":{"gridcolor":"white","linecolor":"white","ticks":""},"bgcolor":"#E5ECF6","radialaxis":{"gridcolor":"white","linecolor":"white","ticks":""}},"scene":{"xaxis":{"backgroundcolor":"#E5ECF6","gridcolor":"white","gridwidth":2,"linecolor":"white","showbackground":true,"ticks":"","zerolinecolor":"white"},"yaxis":{"backgroundcolor":"#E5ECF6","gridcolor":"white","gridwidth":2,"linecolor":"white","showbackground":true,"ticks":"","zerolinecolor":"white"},"zaxis":{"backgroundcolor":"#E5ECF6","gridcolor":"white","gridwidth":2,"linecolor":"white","showbackground":true,"ticks":"","zerolinecolor":"white"}},"shapedefaults":{"line":{"color":"#2a3f5f"}},"ternary":{"aaxis":{"gridcolor":"white","linecolor":"white","ticks":""},"baxis":{"gridcolor":"white","linecolor":"white","ticks":""},"bgcolor":"#E5ECF6","caxis":{"gridcolor":"white","linecolor":"white","ticks":""}},"title":{"x":0.05},"xaxis":{"automargin":true,"gridcolor":"white","linecolor":"white","ticks":"","title":{"standoff":15},"zerolinecolor":"white","zerolinewidth":2},"yaxis":{"automargin":true,"gridcolor":"white","linecolor":"white","ticks":"","title":{"standoff":15},"zerolinecolor":"white","zerolinewidth":2}}},"xaxis":{"anchor":"y","domain":[0.0,1.0],"matches":"x2","showticklabels":false},"yaxis":{"anchor":"x","domain":[0.8,1.0],"title":{"text":"# of pairs"}},"xaxis2":{"anchor":"y2","domain":[0.0,1.0],"title":{"text":"Lag [-]"}},"yaxis2":{"anchor":"x2","domain":[0.0,0.8],"title":{"text":"semivariance (matheron)"}}}, {"responsive": true} ) }; </script> </div>'}
Now export the model to gstools:
exp_model = V.to_gstools()
print(exp_model)

# get the empirical for the plot as well
bins, gamma = V.get_empirical(bin_center=True)

ax = exp_model.plot(x_max=45)
ax.scatter(bins, gamma)
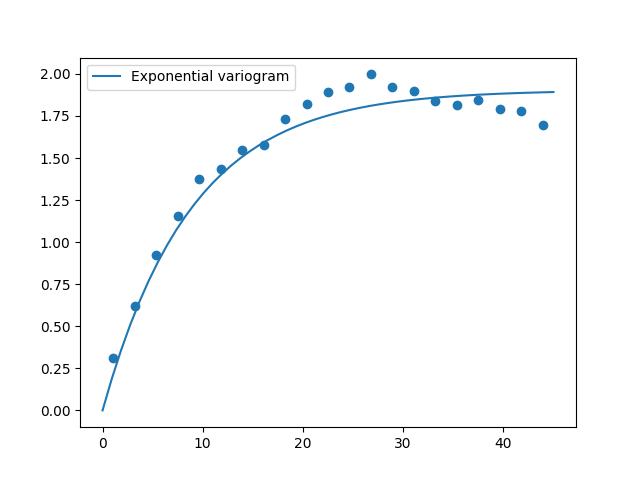
Out:
Exponential(dim=2, var=1.9, len_scale=26.6, nugget=0.0, rescale=3.0)

<matplotlib.collections.PathCollection object at 0x7fbbaf901710>
Note: It is important to understand, that skgstat and gstools handle coordinates slightly different.
If you export the Variogram to a CovModel
and you want to use the Variogram.coordinates, you must transpose them.
6.2.2 Spatial Random Field Generation
With a CovModel, we can use any of the great tools implemented in gstools.
First, let’s create another random field with the exponential model that we exported in the last section:
x = y = range(100)
new_field = gs.SRF(exp_model, seed=13062018)
new_field.structured([x, y])
new_field.plot()

Out:
<AxesSubplot:title={'center':'Field 2D structured: (100, 100)'}, xlabel='$x$', ylabel='$y$'>
Keep in mind, that we did not call a Kriging procedure, but created another field. Of course, we can do the same thing with the more customized model, created in 6.1.3:
malformed = gs.SRF(fit_model, seed=24092013)
malformed.structured([x, y])
malformed.plot()

Out:
<AxesSubplot:title={'center':'Field 2D structured: (100, 100)'}, xlabel='$x$', ylabel='$y$'>
Notice how the spatial properties as well as the value range has changed.
That’s why it is important to estimate Variogram or CovModel
carefully and not let the GIS do that for you somewhere hidden in the dark.
6.3 to_gs_krige
Finally, after carefully esitmating and fitting a variogram using SciKit-GStat,
you can also export it directly into a GSTools Krige instance.
We use the variogram as in the other sections:
# export
krige = V.to_gs_krige(unbiased=True)  # will result in ordinary kriging
print(krige)

# create a regular grid
x = y = range(100)

# interpolate
result, sigma = krige.structured((x, y))

fig, axes = plt.subplots(1, 2, figsize=(8, 4))

# plot
axes[0].imshow(result, origin='lower')
axes[1].imshow(sigma, origin='lower', cmap='RdYlGn_r')

# label
axes[0].set_title('Kriging')
axes[1].set_title('Error Variance')

plt.tight_layout()

Out:
Krige(model=Exponential, cond_no=1000)
Total running time of the script: ( 0 minutes 25.481 seconds)